YouTuber Dan Olson (Folding Ideas) has a new video where he talks about MrBeast’s media empire, and why he thinks that MrBeast has reason to be “spooked” about the future:
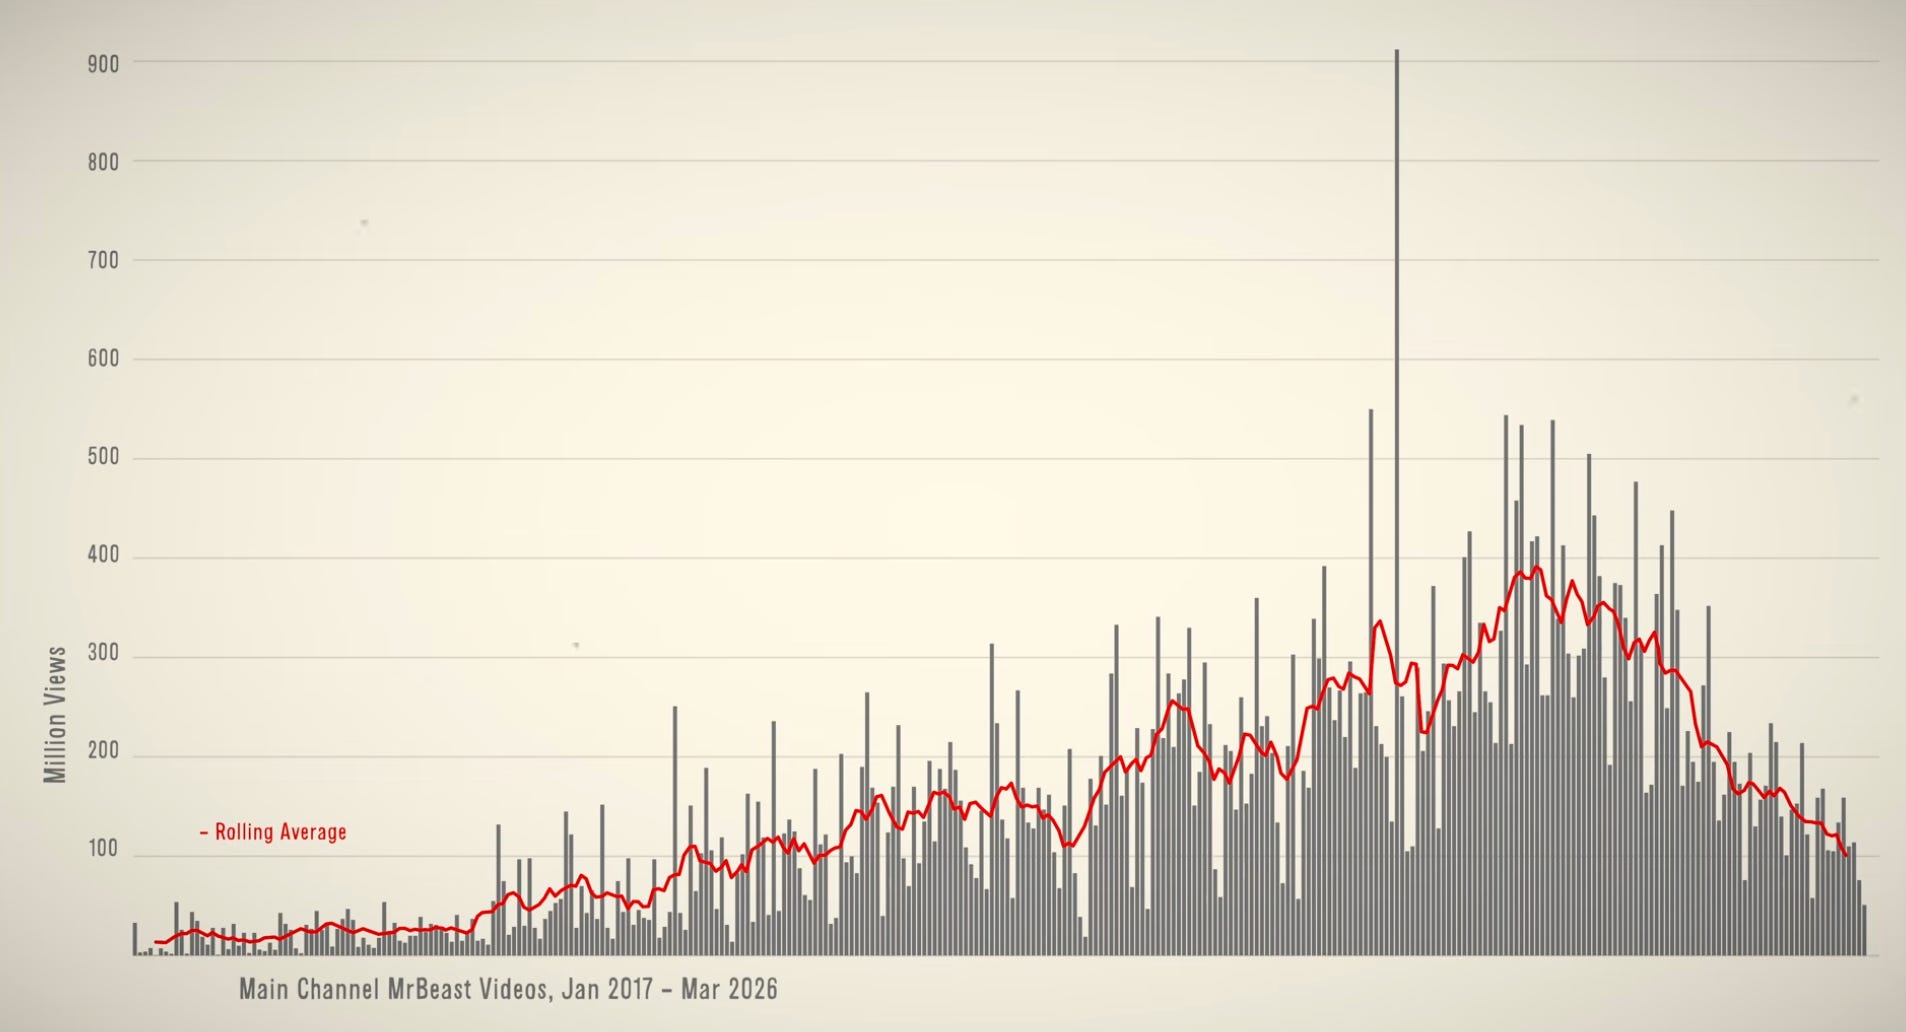
I’m something of a data guy myself. Out of raw curiosity, I graphed the performance of every main channel Mr. Beast video, from his first viral counting video to present. … There is a very interesting trend in the data:
Olson’s graph presents a picture of a media empire that was ascendant for most of a decade, but declined precipitously in the past few years.
Olson, to his credit, notes that “there’s a lot of caveats in these numbers,” and “this is just a single axis of a very complex operation,” but he concludes that “if I were a metrics-obsessed business and I saw this, I might get a little spooked.”
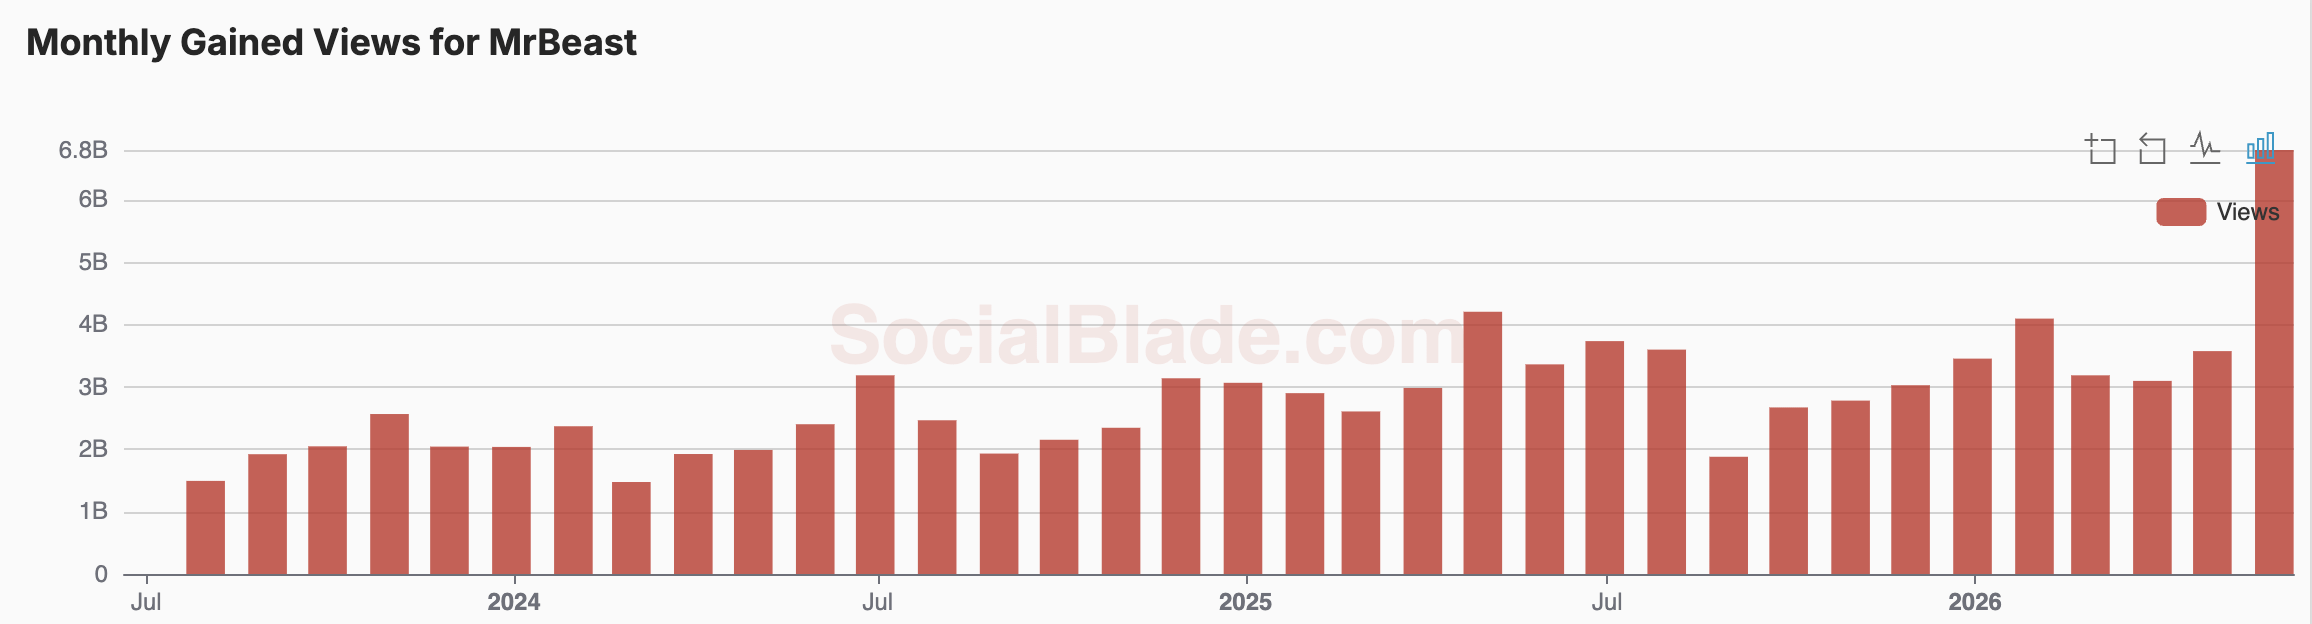
But here’s another graph you might consider: SocialBlade’s report of MrBeast’s “monthly gained views” over the past 3 years from August 2023 - June 2026, the supposed “era of decline” that Dan Olson’s graph purports to reveal:
This graph paints an opposing picture: even ignoring the outlier of the last month, it looks like MrBeast’s channel has been ascendant over the past 3 years, going from an average of around ~2 billion views per month in 2023 to around ~3 billion views per month in 2026. It seems like the MrBeast empire is not only alive and well, but still on an upward trajectory.
Why do these two metrics paint such different pictures, and should we believe either of them? Let’s start by looking at the number that Dan Olson chose for his video:
“Views per video,” and why it’s misleading
If the videos from 2023 have more views than the videos uploaded in 2026, then the new videos are doing “worse,” according to Dan Olson’s logic.
But YouTube videos are long-tail products. The lifetime view count of a video is partly a function of age!
Let’s look at MrBeast’s most-viewed video, “Squid Game in Real Life.”
In October 2023 (when the video was ~2 years old), it had 500 million views. But looking at the video now in June 2026 (when the video is ~4.5 years old), we can see that it has 933 million views.
If you compare a 4-year-old video to a 2-year-old video, you will naturally observe that the 4-year-old video has more views. This is obviously true when we compare a single video to itself at two different points in time, but we should also expect it to be true if we compare two “peer” videos that were uploaded several years apart: the older video has had more time to accrue views! Of course the newer video will have a lower view count!
What about views per day?
The obvious fix to control for age is by dividing by time and looking at “views per day.”
But this doesn’t work cleanly, because YouTube views are heavily front-loaded. Going back to the Squid Game video example, MrBeast’s best-performing video got:
100 million views in ~3 days
500 million views in ~2 years
933 million views in ~4.5 years
The video has continued to perform well, but over 10% of its total lifetime views occurred in 3 days, or 0.2% of the total lifetime of the video. The “views per day” for the first 3 days are literally 60x what they are for the aggregate views per day over the lifetime of the video.
So if we only look at views per day, the newest videos will get unfairly rewarded, because the average views per day goes down over time.
Should we look at the channel as a whole?
Let’s go back to the SocialBlade graph:
“The channel is doing better in 2026 than it was back in 2023,” we might naively conclude. But there are several problems with that assumption.
First, we have the same problem as the Dan Olson graph, but in reverse:
When we look at individual videos, we would naturally expect older videos to have higher viewcounts because they’ve been up longer. Olson’s metric is biased against the present.
But when we look at an entire channel, we should also naturally expect the channel to get more views per month, because the back-catalog is growing over time. This metric is biased toward the present, because the monthly viewcounts for a channel that has 300 videos generating views will look bigger and better than the past version of the channel that only had 250 videos generating views.
There’s another problem with the SocialBlade numbers: the “monthly views” combines two different metrics, views on “shorts,” and views on “longs.” And MrBeast gets a lot of his views from shorts:
Last month, shorts accounted for 6.1 billion views on MrBeast’s main channel, while long-form videos only accounted for 0.67 billion. These are two substantially different content ecosystems, so even if we did want to consider shorts performance, we shouldn’t bundle these together in the same metric.1
So, possessing one metric that will almost always find decline, and another that will almost always find growth, we need a way to compare apples to apples.
The question we really want to answer is this: does a MrBeast video uploaded today actually do worse than a MrBeast video uploaded in 2022?
Comparing different videos at the same age
Earlier, I pulled up timestamped view counts for MrBeast’s Squid Game video. We can do this for all his other videos, courtesy of Viewstats (a YouTube analytics company cofounded by MrBeast himself). For any given video, you can get data showing what their views looked like over time.
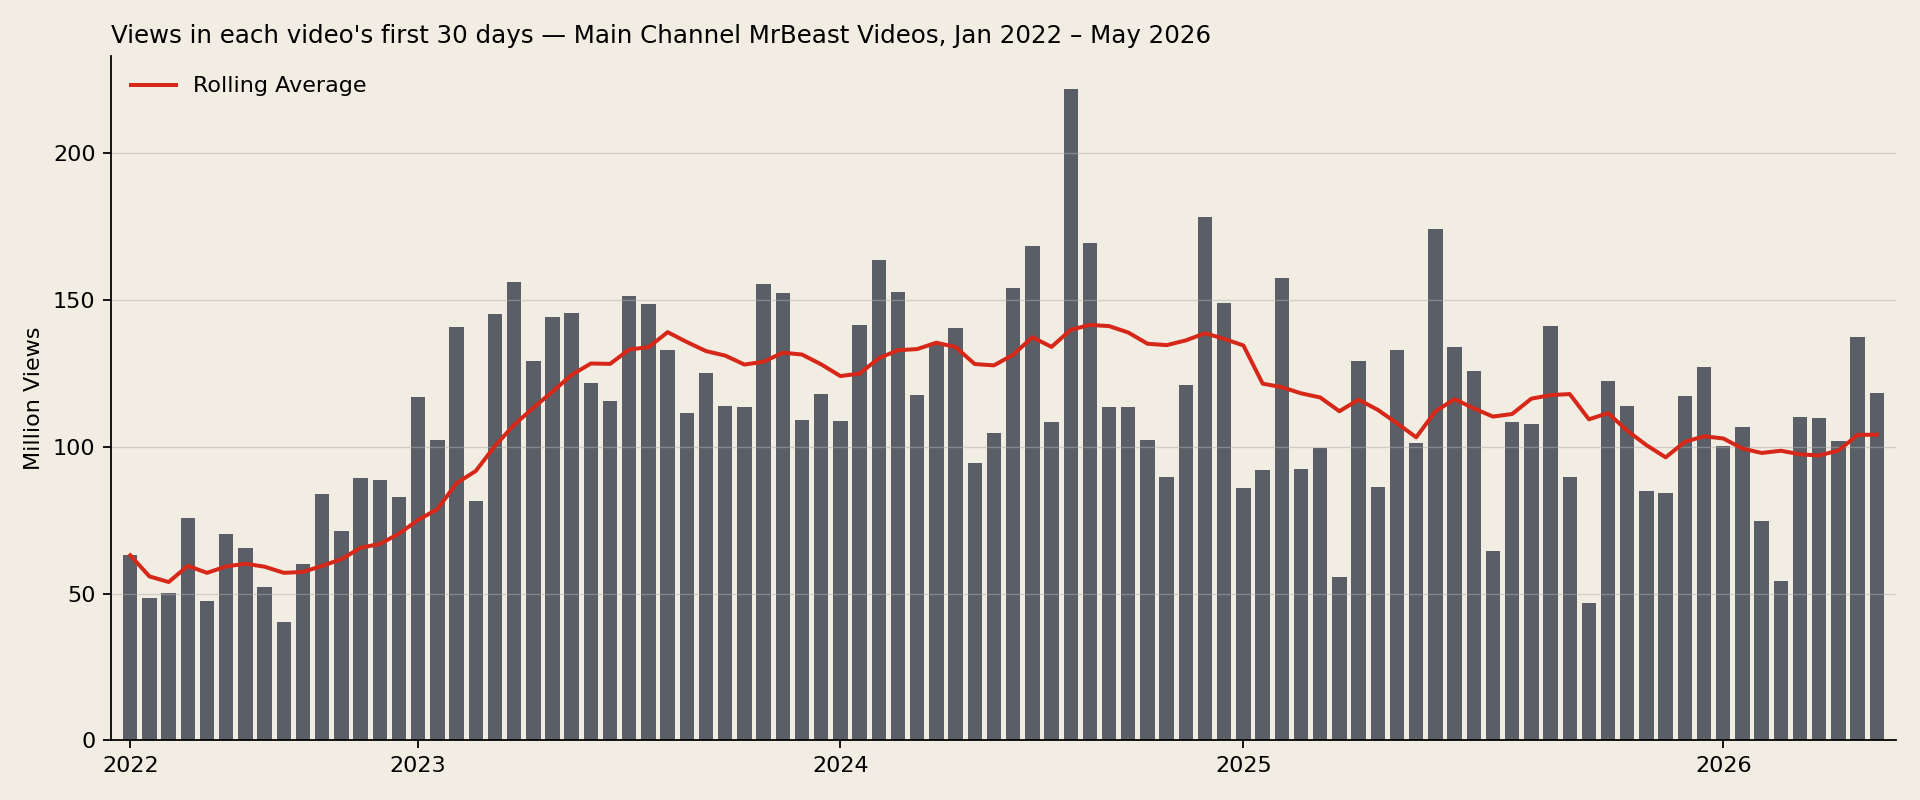
I looked at all of MrBeast’s videos from 2022 to 2026, and for each video, recorded its performance at 30 days old.
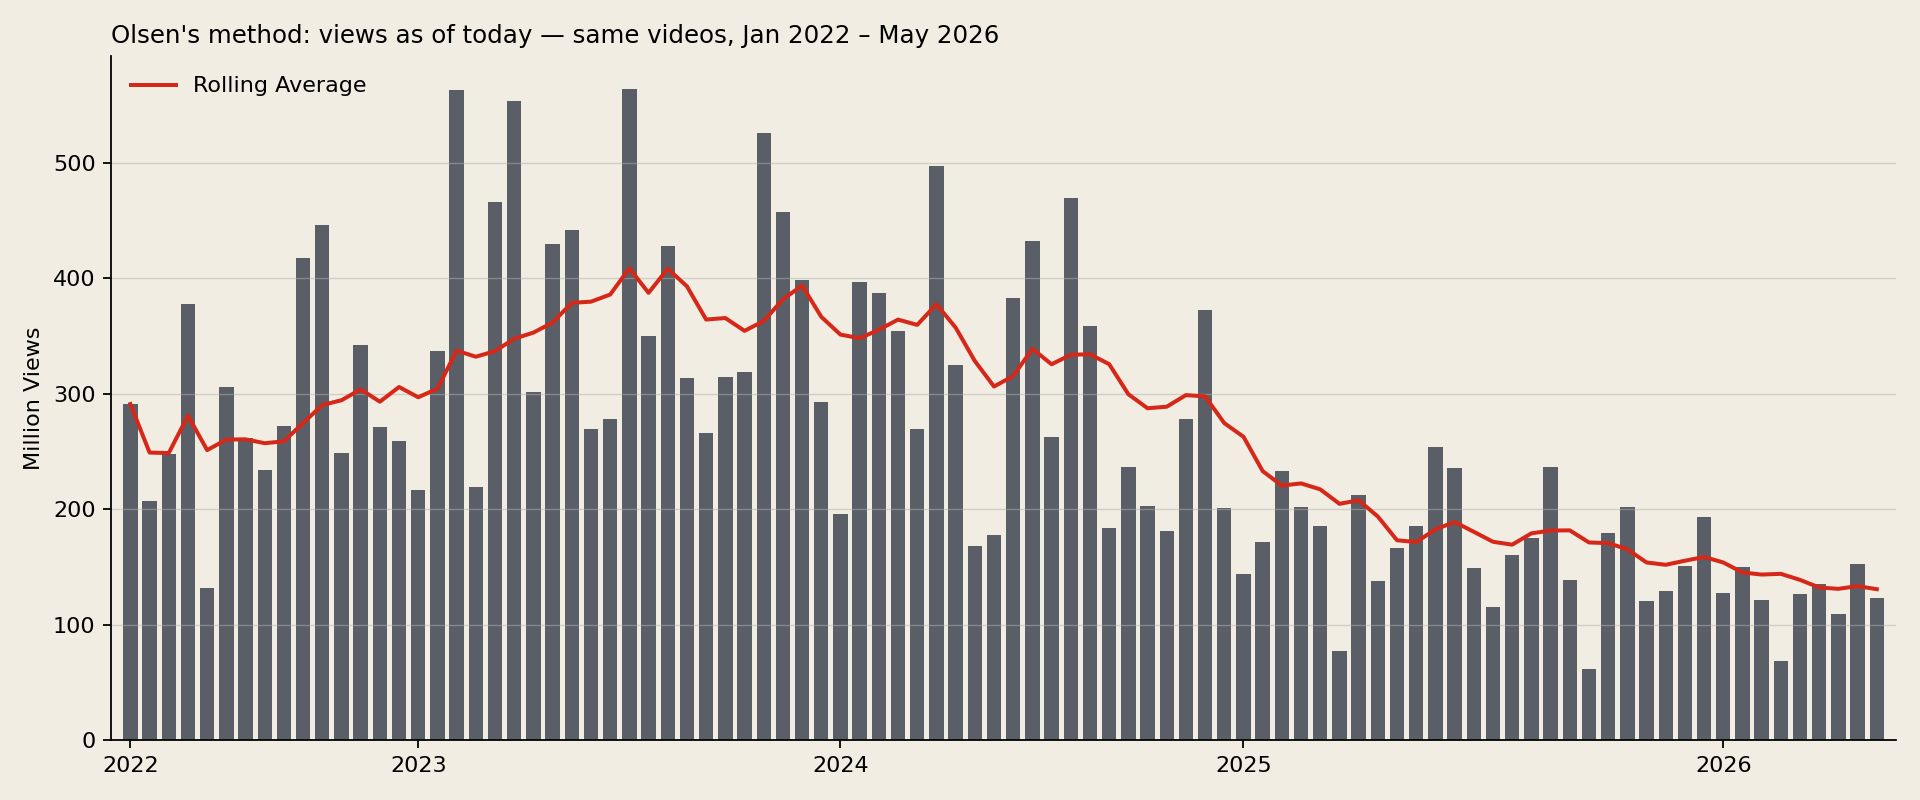
For reference, let’s remember what we’re comparing this to. Here’s a reconstruction over the same period using the Dan Olson method, just looking at lifetime views:
The Olson metric above makes it look like the 2026 videos have worse performance than the 2022 videos, which is plainly not the case if you do a like-to-like comparison, just looking at how each video did during its first 30 days on the platform:
Now that’s more like it!
Here, we see a channel that climbed through 2022, peaked in a long plateau from mid 2023-2024, declined modestly in 2025, and then mostly stopped declining by 2026. The rolling average has been at ~100 million views for about 1.5 years now.
A new MrBeast video released today debuts at around 25-30% below the peak era, but still substantially higher than it did in 2022.
Should we look at a window longer than 30 days?
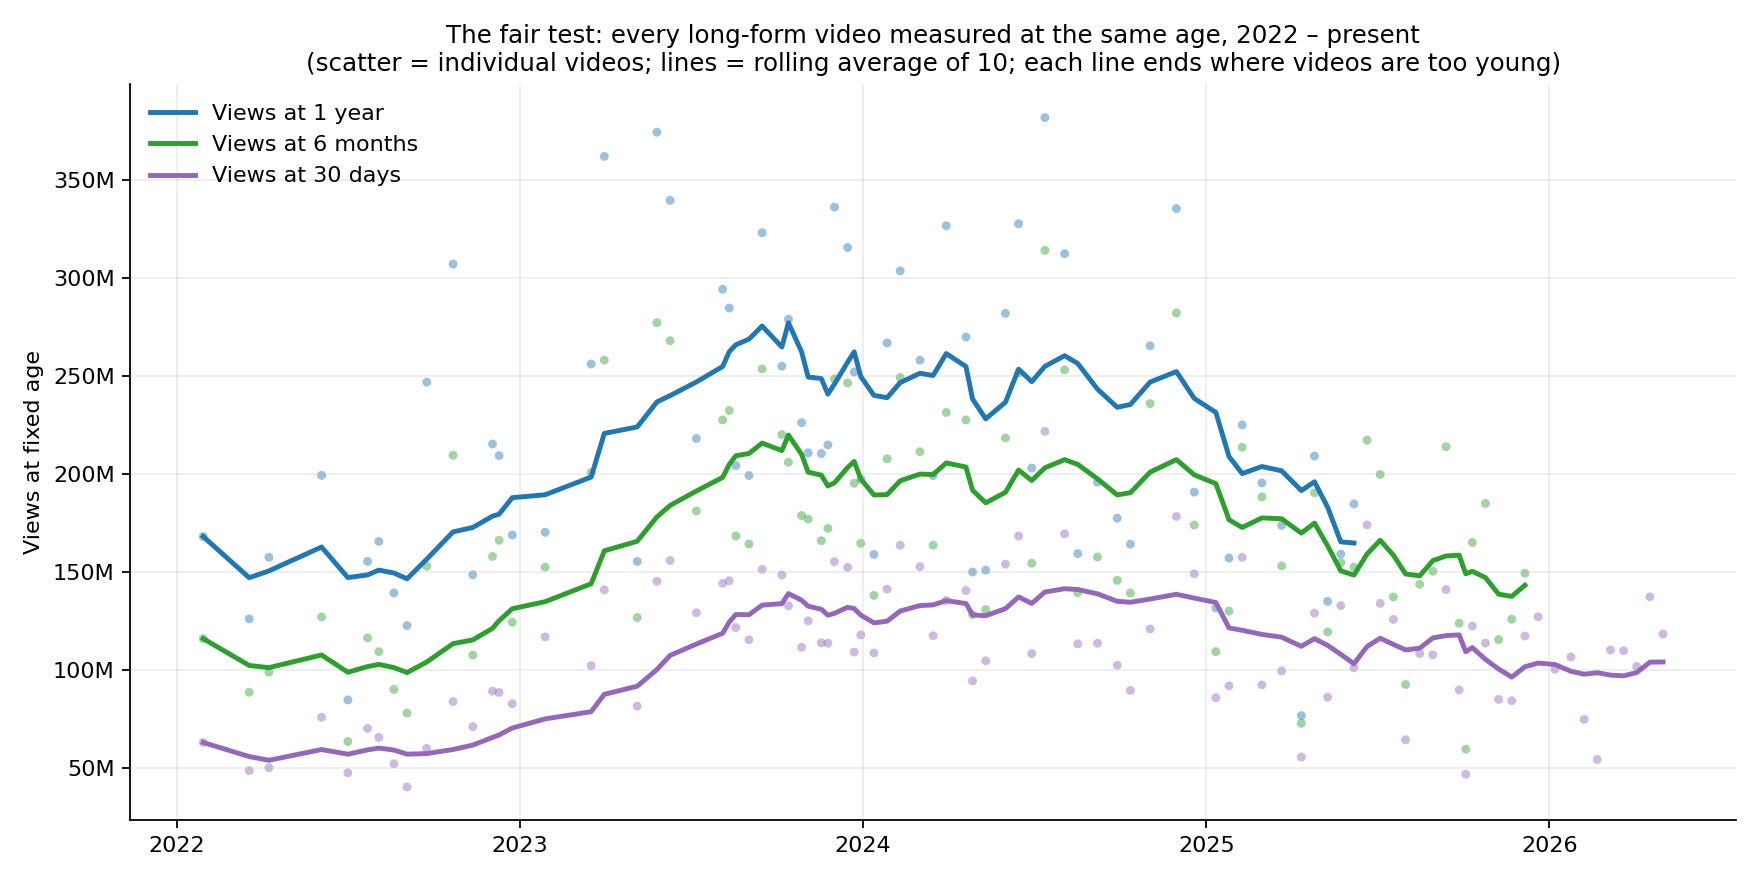
Just as a basic sanity check to see whether “views in the first 30 days” is a meaningfully different metric from e.g. “views in the first 6 months” or “views in the first 12 months,” here’s a comparison of all those metrics:
It’s about what we would expect: it seems like a video’s performance at 1 month in is a highly predictive of how it will do at 6 months or 12 months. That said, the delta between 6-months and 12-months does seem to be smaller in 2025 than it was in 2023 (a “shrinking of the tails” (more on that later).
Should a metrics-obsessed business be “spooked?”
While the actual picture is not nearly as catastrophic as the one painted by the Dan Olson graph, the decline is real; a 25-30% drop is certainly a real business event, and if I worked at MrBeast HQ, I’d certainly want to know why this decline was happening. Some plausible theories to investigate:
More people are watching shorts, does this naturally mean fewer watch hours for long-form video? (This seems plausible to me; MrBeast’s content does pattern-match to the kind of viewer who would opt for the short-form dopamine treadmill)
The 2025 decline followed a series of MrBeast controversies in 2024: Beast Games contestants filed a class action lawsuit, a former staffer published a pair of expose-style videos calling MrBeast a “sociopath” and a “fraud,” and a series of allegations (later found “baseless” and “soundly rejected, including by alleged victims”) led to long-time MrBeast collaborator Ava Kris Tyson stepping away from the channel. (If you want to time-stamp the “vibe shift,” Time published an article about the various controversies on August 13, 2024)
The 2023-2024 peak may have been artificially high due to platform consolidation: in early 2023, YouTube launched multi-language dubbing. (MrBeast retired his international channels, funneling a large amount of Spanish-speaking and Hindi-speaking viewers onto his main channel.)
The actual scariest graph
Earlier, I mentioned “the tail is shrinking” and said we’d get to back to that, so let’s return to this graph:
Here, we see lines tracking video performance at 1 month, 6 months, and 12 months. In 2023, we see that the delta between 1 month and 6 month is not so different from the delta between 6 and 12 months: these videos have a long tail.
However, look at what we see in 2025, especially getting to where the blue line ends. The delta between the green line (6 months) and blue line (12 months) is shrinking: performance past 6 months is dropping off a cliff.
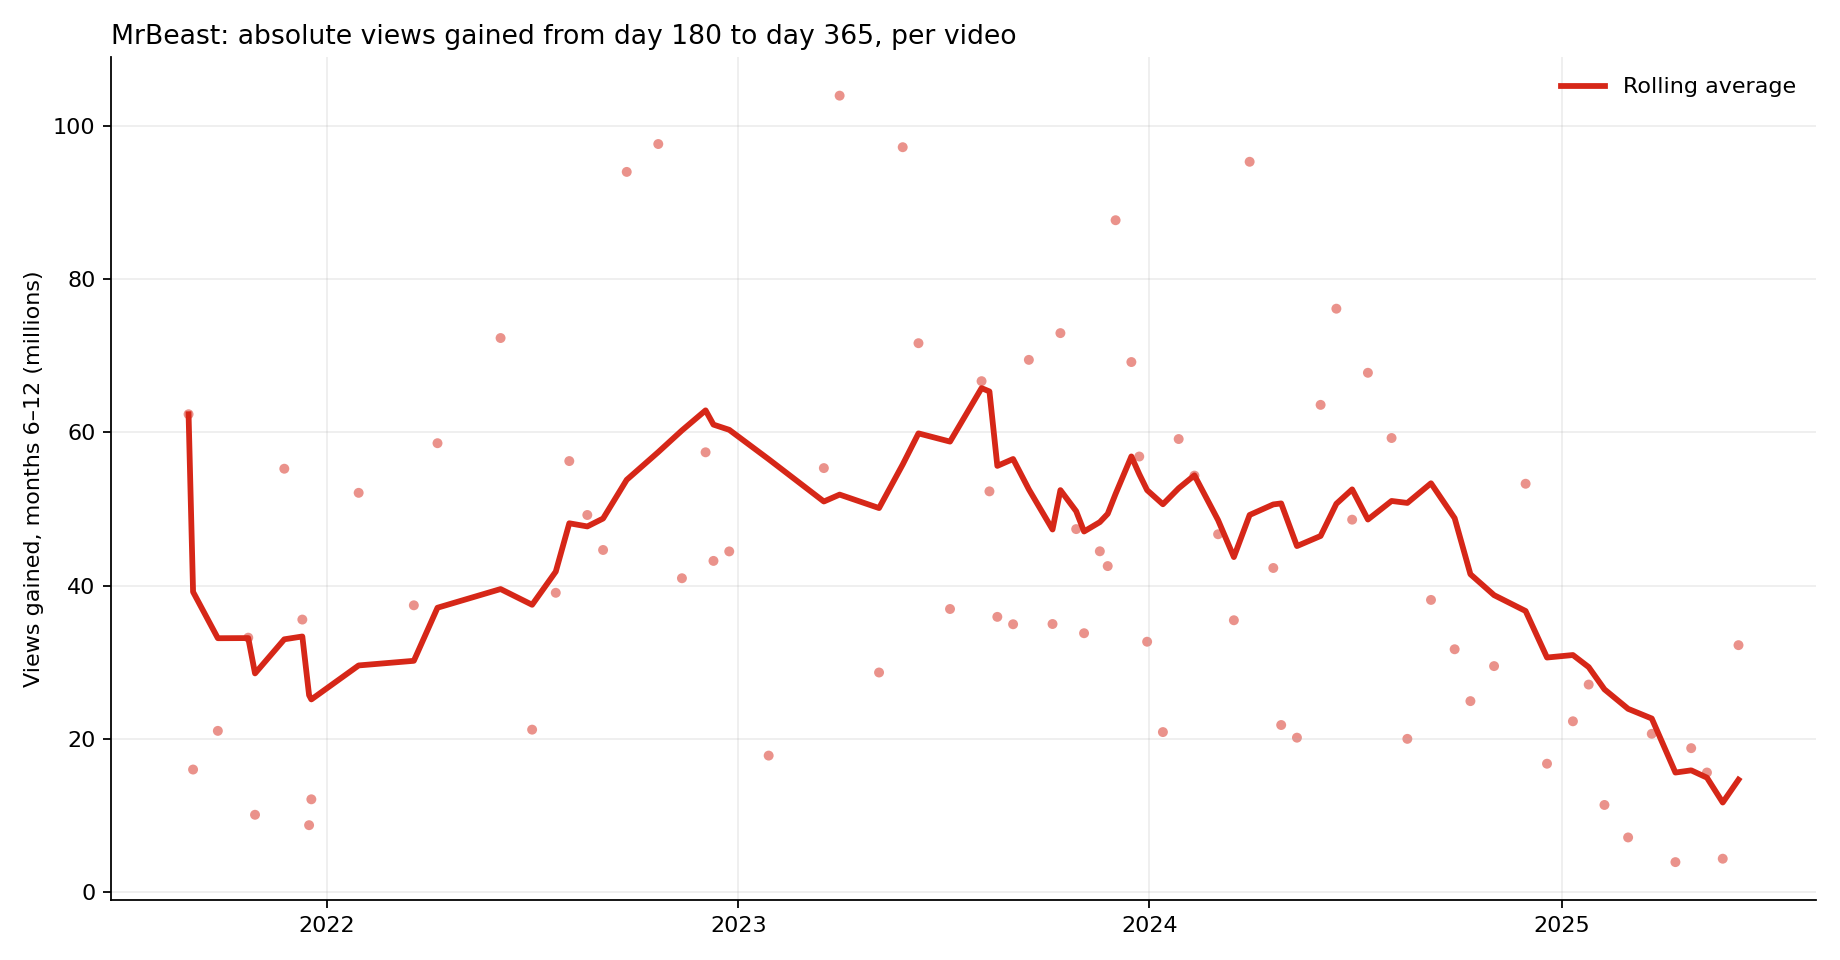
Let’s just look at “total views gained from 6 months to 12 months” over time (based on upload date):
When we just looked at the 30-day window, the dropoff between MrBeast’s peak and current era looked modest, maybe a 30% dropoff. But here, looking at the longer tail of views from month 6-12, we see that the 2025 videos are doing ~70% worse than the 2023 videos
That is the scary part for MrBeast’s team: as I have repeatedly emphasized throughout this post, “YouTube videos are long tail products.” (That’s why older videos have higher view counts than new ones, and why the channel’s “views per month” are going up over time.) But while MrBeast’s new videos are still popular in their early days, they no longer have that long-term staying power.
Shrinking tails: just a MrBeast problem?
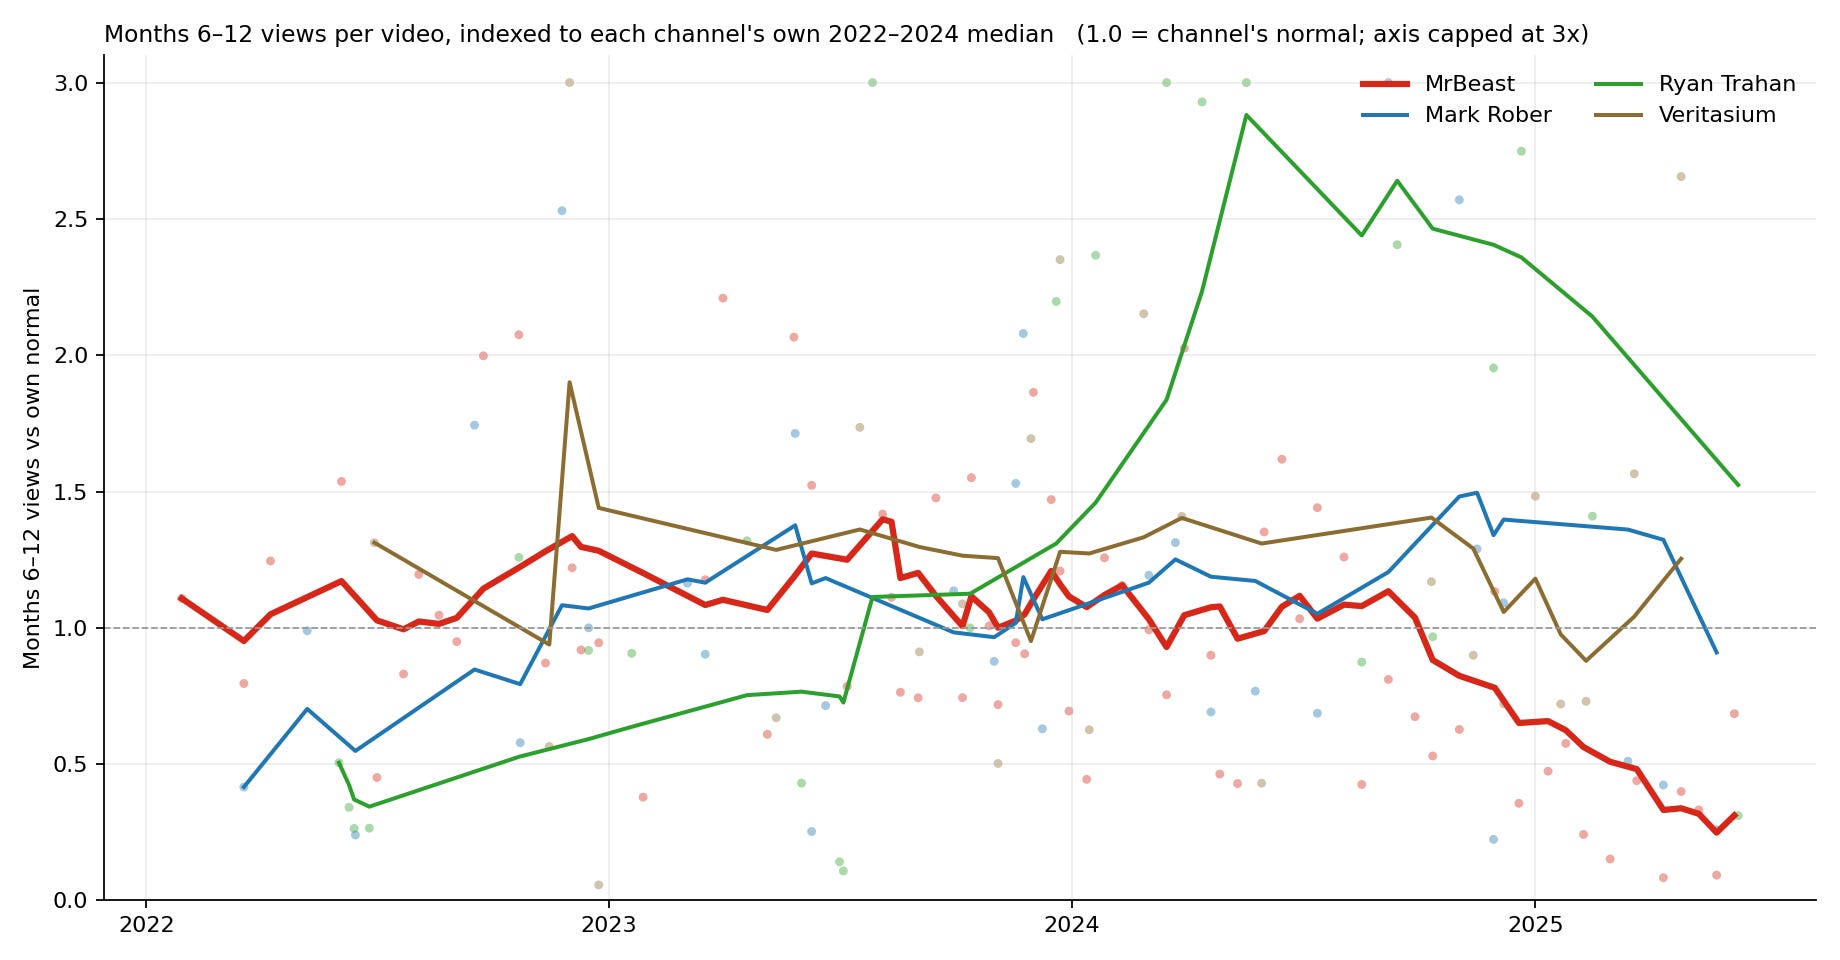
Is the shrinking tail something that’s happening platform-wide? We can look at other YouTubers to see what their view growth from “6 months” to “12 months” looks like. I pulled the same stats for several other big YouTube channels (Mark Rober, Ryan Trahan, Veritasium) for the same period, and here’s what I found:
Looking at where the red line (MrBeast) ends up, it seems like this dramatic shrinking of the long tail is specifically a MrBeast thing: he’s the one creator in this analysis who has consistently and dramatically declined in this metric since 2023-2024.
So, perhaps Dan Olson was right after all: maybe there is something specific about MrBeast’s viewership decline that should give him reason to be spooked.
Want to see me investigate more YouTube stats for other channels? Subscribe:
In addition to being a stats guy, I’m also a YouTube guy with 8 years of experience working on large channels like Game Theory, Food Theory, and AI Species. If you want to hire me, reach out and let’s talk about it!
There’s the fact that what counts as a view on “shorts” has changed over time. Prior to March 31, 2025, a “view” on shorts was only counted if a user watched for a certain number of seconds. Now, the shorts player will tally a view as soon as the video starts playing.